The atmospheric observatory at the top of the 190m-tall BT Tower is ideally placed to measure the changes in greenhouse gas emissions in London as a result of the COVID-19 lockdown. It reveals there has been an average daytime reduction of almost 60 per cent in carbon dioxide emissions. Here, Environmental Physicists Eiko Nemitz and Carole Helfter, of the UK Centre for Ecology & Hydrology, and Janet Barlow, of the University of Reading, explain how emissions are measured and what the data from the lockdown period have shown...
The lockdown in response to the COVID-19 epidemic has resulted in a major reduction in traffic associated with commuting, school journeys and shopping activities as well as tourism. Some industries have been shut down completely while others have been scaled back.
This can be seen not only in the numbers of cars on the roads and traffic congestion, but also in many statistics on sales, consumption and production: for example, UK petrol sales are down by 70 per cent and European aviation activity is down by more than 90 per cent. From these statistics the theoretical associated reduction in emission of CO2 can be estimated.
For example, carbon dioxide (CO2) emissions from Europe’s electricity system are thought to have fallen by 39 per cent as overall demand has decreased by some 17 per cent and renewables cover a larger share of the total. Globally, industrial emissions in the first quarter of 2020 are thought to have been down by 7.1 per cent, road transport by 8.3 per cent, aviation by 8.0 percent and power generation by 3.8 per cent.
Emissions of the other main greenhouse gases, methane (CH4) and nitrous oxide (N2O) are likely to have decreased to a lesser extent, because key sources for these gases such as leaks from the gas supply network and landfill sites for methane, and agricultural activity for both gases, will have remained largely unaffected by COVID-19.
Whilst there should thus be a reduction in emissions of greenhouse gases in theory, there are few direct measurements in the atmosphere that can provide independent confirmation. Deriving emission changes from the evolution of atmospheric concentrations is notoriously difficult: for short-lived pollutants, such as nitrogen oxides, concentrations increase near their sources and this is easily seen in surface measurements and from space.
By contrast, CO2 accumulates in the atmosphere and local emissions only cause minute local increases in concentrations. CO2 concentrations overall will be continuing to rise, just at a slightly reduced rate, which is very challenging to decipher. Spatial concentration fields are measured at very high precision across tall tower networks from which emissions can be inferred using numerical models, for example by analysing how atmospheric CO2 increases as air moves across the UK.
Rather than relying on changes in concentration, we measure London’s emissions directly using instrumentation mounted at the top of the BT Tower. These measurements reflect emissions from sources within a few kilometres of the BT Tower, in the direction from which the wind blows at the time of sampling.
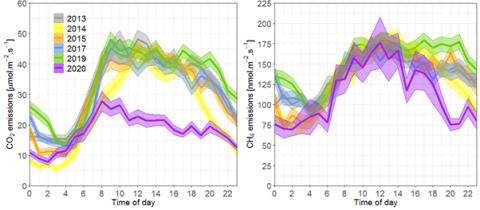
This provides a measurement-based validation of the emission reduction but it also reveals what the national statistics mean for local inner-city emissions. For CO2, these emissions have reduced greatly in central London during the 2020 lockdown period (purple trace in the figure below left) compared with what was measured during the same period (March/April) during previous years (other colours). For CH4 (the figure below right) we measure a much smaller reduction compared with previous years, occurring mainly during the second half of the day.

Figure 1. Diurnal cycle of the CO2 and CH4 emissions from central London since lockdown (purple) compared with the same time of year in previous years. The shading represents the day-to-day variability.
The emissions measured above the city reflect a combination of all urban sources and sinks (processes that remove gas from the atmosphere) in central London: sources include vehicle emissions, natural gas usage for heating of houses and commercial properties, but also the exhalation from people and emissions from soils.
The sink is dominated by the photosynthesis of vegetation in gardens, parks and along streets. For CH4 the main inner-city sources are leaks in the gas supply network as well as the escape of un-combusted CH4 form appliances such as gas boilers and gas cookers during start-up.
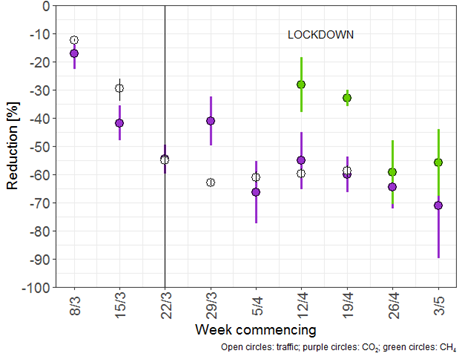
The measurements enable us to investigate how emissions have changed as lockdown was introduced. In the run-up of the Prime Minister’s announcement of lockdown on the evening of 23 March, daytime CO2 emissions in central London had reduced by 17 per cent in the week commencing 8 March and 42 per cent in the week starting 15 March.
Since lockdown, emissions between noon and 6 pm have been down by 59 per cent on average (purple circles in the figure, below) compared with the long-term average for this time of year, and by 58 per cent for the period 8 am to 8 pm. This almost perfectly matches the reduction in traffic flow in central London as provided by Transport for London (open circles). Vehicle emissions are thought to be a key source of CO2 emissions in London.

Figure 2. Weekly evolution of the reduction in daytime emission of CO2 and CH4 compared with previous years, in relation to the reduction of road traffic in central London (only currently available until 25 Apr).
However, other sources, and in particular CO2 emissions from commercial heating and human emissions may also correlate with traffic: according to 2011 Census data, in normal times, the daytime population in central London exceeds the night-time population by a factor of 10. Reduced commercial activity results in less transport, less heating of offices and shops as well as fewer people. Measurements of CH4 emissions (green circles) do not cover the full period, but they show more variability between weeks with a mean daytime reduction of 44 per cent.
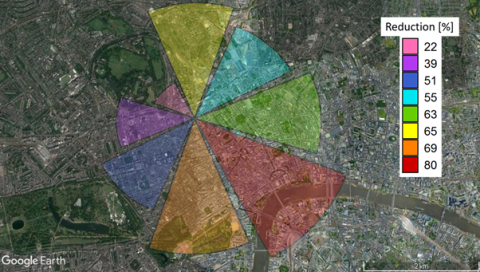
It is important to note that, as seen from the BT Tower, the city looks very different in different directions, and each wind sector contains a different mix of sources. As the next figure, below, shows, this is reflected in the magnitude of the emission reduction for different wind directions.

Figure 3. Reduction in daytime CO2 emissions since 15 March 2020 compared with previous years for different wind directions as seen from the BT Tower. Image © Maxar Technologies, CNES/Airbus
For example, the northwest wind sector of the BT Tower is heavily influenced by Regent’s Park and here emissions have hardly changed. By contrast, the largest reductions in CO2 daytime emissions can be seen in the south east, the south and north, in areas containing major transportation links and commercial activity.
This measurement of urban emissions is unique in the UK, but it is replicated in some cities abroad and forms part of a small informal network linked to the European Integrated Carbon Observing System (ICOS). A first analysis across sites, with a somewhat different methodology than used here, paints a consistent picture of urban CO2 emission reductions, but also highlights differences with respect to timing of the lockdown and magnitude of the change, ranging from 8 per cent in a highly vegetated urban area in Berlin, Germany, to 75 per cent in the city centre of Heraklion, Greece.
The measurements on London’s BT Tower also provide a powerful platform to monitor how CO2 emissions will evolve as we gradually come out of lockdown. Will the government advice to avoid public transport together with the incompatibility between social distancing and car sharing and low fuel prices mean that individual car use will spike to levels that exceed emissions before the lockdown? Or will home working carry on at a scale that will continue to reduce mobility and therefore carbon emissions? Or perhaps the lockdown has kick-started a new enthusiasm for walking and cycling that will endure so that vehicle numbers and emissions will never fully recover to pre-lockdown levels? Our measurements will continue to tell the story…
Further information
The BT Tower Atmospheric Observatory is a collaboration between UKCEH, the University of Reading and the National Centre for Atmospheric Science. Measurements of CO2 and methane emissions first began in 2006. The research is supported by National Capability funding from the Natural Environment Research Council (NERC). UKCEH is a strategic delivery partner for the NERC, part of UK Research and Innovation (UKRI).
The ICOS study used slightly different methodology and timeframes to the measurements quoted for London in this release. The study, which has not yet been peer reviewed, is available at https://data.icos-cp.eu/objects/w6pTmRGYKqAm3c-siQrg5kgd