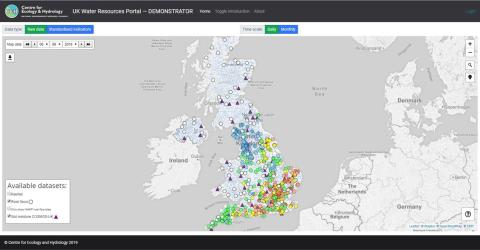
The Centre for Ecology & Hydrology has launched a new web portal that allows users to assess information about the latest hydrological situation and drought conditions across the country in near-real-time. Here, Jamie Hannaford, part of the team that developed the online tool, discusses how it can be used and explains that people can help shape its development...
The UK Water Resources Portal is a prototype web-based system for tracking the hydrological situation in near-real-time.
Like CEH’s existing UK Drought Portal, the new system offers dynamic, interactive situation monitoring, mapping and plotting. The key difference is that the new portal features a wider range of variables, not just rainfall, but also river flow and soil moisture measurements, and some data are updated every day instead of monthly.
It features live data from our COSMOS-UK soil moisture monitoring stations, while river flows across England are fed in from the new Environment Agency hydrological data service. There are a number of other innovations in the way data can be visualised, which are discussed below.
The portal is a ‘demonstrator’ as it is still a work in progress that is being developed and is undergoing user-testing until the end of 2019 when it will be fully operational.
The web address is https://eip.ceh.ac.uk/hydrology/water-resources/

Who is the UK Water Resources Portal for?
The new portal is aimed at anyone with an interest in current water resources situation or drought conditions. We envisage this would include a wide range of people involved in water management, e.g. water supply companies, policymakers, regulators, consultants, academics, farmers and growers, businesses (particularly those which are heavily dependent on water abstractions) and power companies. Given the interactive nature of the portal and the capacity to explore data on a localised scale, we also hope it provides a useful dataset for the media and the wider public.
The primary focus of the portal is for water resources and drought applications, but it can also be useful for tracking river flows and soil moisture in real time in order to provide an indication about high flows, as well as low flows. Other real-time services exist for real-time flood level monitoring, and these are the primary outlets that should be consulted from a flood warning perspective. The portal offers a way of exploring the full range of river flow variability, including comparing current conditions to those in the past, from droughts to floods and all points in between.
What is on the portal and how does it work?
The portal provides access to the following datasets;
- Rainfall from the Met Office (gridded, and over gauged catchments and hydrometric areas)
- River flows from the National River Flow Archive (for historical data) and Environment Agency (for real-time data)
- Soil moisture (from CEH’s COSMOS-UK network)

Left: NRFA Gauging Station the 23004 South Tyne at Haydon Bridge © National River Flow Archive Right: COSMOS-UK station Balruddery, Scotland © COSMOS UK
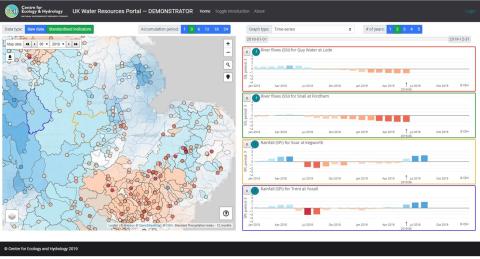
The portal allows users to explore these datasets spatially, using a map interface, and then to plot graphs showing time series data of these variables for their selected locations.
There are a number of ways these datasets can be visualised. For rainfall, river flows and soil moisture, the raw data can be plotted. In this mode, for river flows, the map shows colours displaying the current daily/monthly flow in the context of the historical record using coloured ‘bands’ (exceptionally high, notably high, and so on to notably low and exceptionally low).
When users click on the points, hydrographs are shown of the recent flows against these same bandings - as used in the Water Situation Reports produced by the Enivronment Agency. We adopted this visualisation approach following feedback from users in the water industry, as these are widely used for communication.
Users can also choose to show the current flows against maximum and minimum flows, and against historical drought years. This is very useful for practitioners wishing to assess how the current river flow situation compares with known, major historical droughts, for example.

For COSMOS-UK, the soil moisture data records only date back up to five years so the time periods are too short to use bandings, and the sites are not coloured on the map. Users can still plot time series of soil moisture against the historical maximums and minimums. Importantly, users can plot both soil moisture and river flow graphs next to one another to compare these variables.
The river flows and rainfall data can also be presented as ‘standardised indicators’ as used on the UK Drought Portal. Once again, the current values of the indicators are shown as colours on the map, and when locations are clicked, time series plots of the indicators can be shown.
These standardised indicators essentially show the anomalies from the long-term average, with negative values indicating that it was drier than normal or flows were lower than normal, and positive values that it was wetter than normal or flows were higher than normal. The way these indicators are calculated means that you can compare values across time and space making them useful to monitor the hydrological situation.
Why have we produced it?
We have developed the portal primarily as a near-real-time tool to aid water resources monitoring in the UK.
There are many other sources of information that can be used for situation monitoring, notably the Hydrological Summaries produced by the National Hydrological Monitoring Programme, the Environment Agency Water Situation Reports and similar products developed by Natural Resources Wales (NRW) and the Scottish Environment Protection Agency (SEPA).
These publications remain a key mechanism for tracking and interpreting current hydrological status of the UK. The portal is meant to complement these, rather than replace them, and provides a more interactive way of accessing data. For example, it allows users to explore more localised and customised information than the selection of catchments and regions presented in the Hydrological Summaries, which are static PDF documents.
It’s worth noting that EA, NRW and SEPA have regulatory and operational duties to plan, respond to and manage dry weather and drought incidents in order to mitigate their impacts on people and the environment. While we anticipate that the portal will provide useful information to support assessment of drought conditions for a broad range of users, it is important to emphasise that regulators have particular triggers and terminology used to officially declare drought status.
What does the future hold for the portal?
As noted above, this is a prototype designed to showcase what is possible with the new real-time data streams becoming available, and to seek feedback from users.
Please visit the About page of the portal and email comments to nhmp@ceh.ac.uk
We plan to use the portal as a foundation for adding further data streams, notably groundwater levels (in collaboration with our colleagues in British Geological Survey) and potentially other sources such as earth observation products and hydrological modelling outputs. In the future, we also plan to incorporate forecasting information from the UK Hydrological Outlook.
The portal will be managed by CEH as part of the UK National Hydrological Monitoring Programme (the home of Hydrological Summaries and the existing UK Drought Portal) and funded by our National Capability programme UK-SCAPE[BLJ3] .
While real-time river flows are only available for England at present, we are engaging with agencies in Scotland, Wales and Northern Ireland on the potential for real-time datasets from these nations.
Acknowledgments
The portal has been developed thanks to the valuable contributions of a very wide range of stakeholders and also through work on several NERC-funded drought projects – DrIVER, Historic Droughts and ENDOWS. Much analysis has been undertaken in these projects to test the utility of drought indicators for indexing drought severity in the UK, and in all these projects we have worked with a very wide range of users to develop first the UK Drought Portal and now the UK Water Resources Portal.
Specifically, within ENDOWS we worked with South West Water and the Environment Agency in Devon and Cornwall to develop a prototype portal for the south west of England to work out how these different datasets can be brought together and how data can be presented to work alongside existing monitoring tools such as Environment Agency Water Situation Reports. We are particularly grateful to both these two organisations for their co-operation and feedback, as the prototype regional portal formed the basis of the new national demonstrator.
We are also grateful to the Environment Agency for the use of its hydrological data service and flow regime bandings, and to the Met Office for provision of the rainfall datasets.
We also thank the many wider users who have road-tested the portal over the last few months and who will provide feedback over the coming weeks. Please visit the About page of the portal and submit your comments .
The portal is being CEH staff Jamie Hannaford, Matt Fry, Gemma Nash, Lucy Barker, Maliko Tanguy and Oliver Swain.