The project estimated national changes in river flow indicators using the perturbation method with climate change factors extracted from the Future Flow Climate projections for the 2050s for each of the 11 members. The climate change factors were then used to scale the observed (baseline) climate to generate time series representative of the future used to drive the hydrological model CERF. Because Future Flows Climate is based on HadRM3-PPE, the changes are only associated with the A1B emission scenario. However, some climate variability and uncertainty is captured by the ensemble of the maps, with each ensemble member equally likely.
Once the river flow simulations were done using baseline and future climate, hydrological indicators were estimated and differences between baseline and future indicators mapped.
The maps are presented as
and for monthly flows grouped by seasons:
Overview
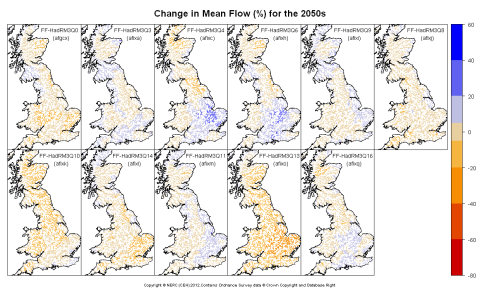
Changes in mean annual flow are mainly within ±20% with large areas suggesting ±5% changes (buff colour). Small increases are shown for about half of the scenarios, concentrated in the south and east. For the majority of the scenarios the west will see a reduction of mean annual flow up to -40%. Note, one scenario suggests decreases of up to -40% for the south and east. In Scotland, simulations suggest no changes or a reduction in mean annual flow.
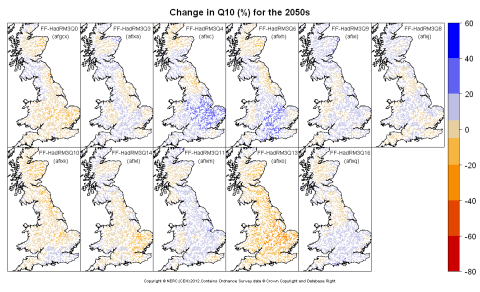
Changes in Q10 focus on the high flow part if the regime (Q10 is the flow exceeded 10% of the time). While changes are within +/- 20% for most Great Britain and ensemble members, the geographical pattern between increase and decrease is complex and vary. Some larger changes (up to increase of 60%) are suggested for the midlands for two scenarios and for East Anglia and southern England for one scenario each. Conversely, reductions up to 40% are only suggested by one scenario but across most of Eastern England. Changes in across most of Scotland tend to remains within +/- 5% for 7 scenarios but to increase up to 20% for two scenarios. For the others, the pattern is mixed between a 5% reduction to a 20% increase.
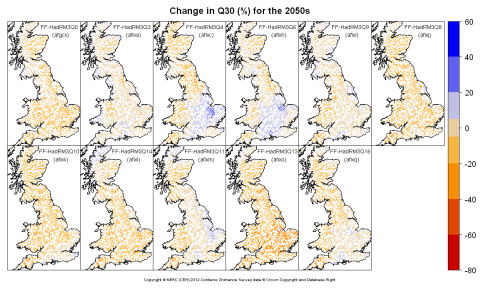
Changes in Q30 focus on the medium-high flow part if the regime (Q30 is the flow exceeded 30% of the time). Generally Q30 is projected to remain unchanged (buff colour, +/- 5% change) or to decrease but the size of reduction does not exceed 60% of a few rivers of East Anglia (but 1 scenario only). For two scenarios, Q30 is projected to increase by 5 to 20% (with peak of 40% for the Marsh) in central and eastern England.
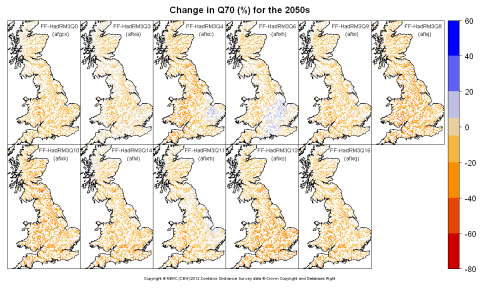
Changes in Q70 focus on the medium-low flow part if the regime (Q70 is the flow exceeded 70% of the time). Generally Q70 is projected to decrease for Great Britain in all but 2 scenarios, where increase of up to 20% are projected for small parts of East Anglia and central and southern England. The magnitude of reduction is generally not greater than 60% - and this only occurs for 2 scenarios with different spatial extent.
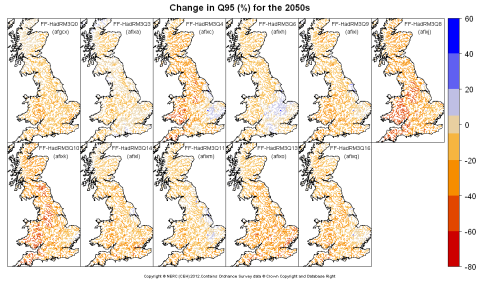
Changes in Q95 focus on the low flow part of the regime (Q95 is the flow exceeded 95% of the time). As for Q10, Q95 is projected to decrease by 2050s anywhere in Britain according to all but 2 scenarios with small increases in the east and/or centre. The size of decreases is variable, with areas such as northwest Scotland and northwest England showing little change for 2 scenarios, to reductions of up to 80% in Wales and northwest England for up to 3 scenarios. But most scenarios do not suggest reductions to exceed 60%.
Related links
Future Flows: National changes in river flows grouped by season
Future Flows and Groundwater Levels project home page