Scientific challenge

Sand dune habitats are one of the most natural remaining vegetation types in the UK. They support more than 70 nationally rare or red-data book species, and are a refuge for many lowland species lost due to agricultural improvement.

The open dune habitats in particular are important for a range of specialised species: plants which are poor competitors; insects which require bare soil for burrowing; and threatened reptiles and amphibians such as the sand lizard, natterjack toad. UKCEH sand dune research covers the following themes:

  • Dynamic dunes are naturally dynamic but this situation has changed over the last 50 years. We are studying why this is, and what the impacts are. 
  • Dune slack wetlands are sensitive to climate and nutrient enrichment. We are studying the complex interactions between hydrology, plants and soils to predict the impacts of climate change.
  • Nitrogen impacts: Nitrogen pollution causes dramatic loss in dune biodiversity and alters soil processes. We use field-experiments, surveys and modelling to measure and understand these effects.
Project overview

Dynamic Dunes

Image
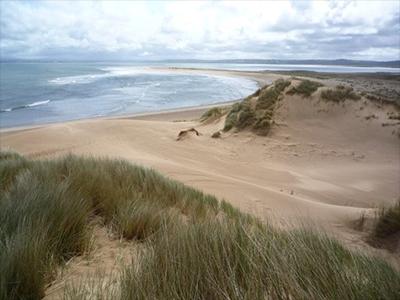
Large blowout at Whiteford Burrows
Above: Large blowout at Whiteford Burrows

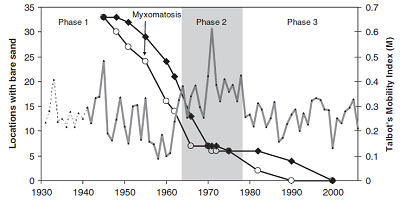
Dunes are naturally dynamic. However, over recent decades, dunes across north-west Europe have become over-stabilised, due to a combination of reasons. We have been studying change over time at Newborough Warren using a chronosequence (studying dunes of different ages). This suggests that changes in climate and increases in nitrogen deposition are important factors in promoting dune stability and soil development, as well as reductions in traditional management practices such as grazing. Interestingly, many of these changes started before the rabbit population was devastated by myxomatosis.

Image
Graph of locations with bare sand or partially vegetated at Newborough Warren
Graph showing locations with bare sand (open circles) or partially vegetated (black diamonds) at Newborough Warren linked to climate, from Jones et al. (2010)

Dune slack wetlands are sensitive to climate and nutrient enrichment

Image
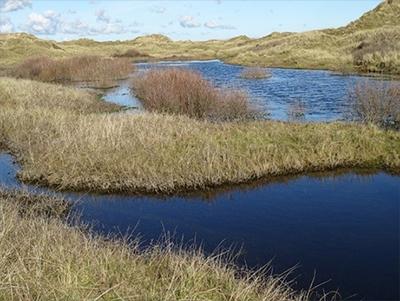
Flooded dune slacks at Aberffraw dunes in winter
Photo: Flooded dune slacks at Aberffraw dunes in winter

Hydrological change

Image
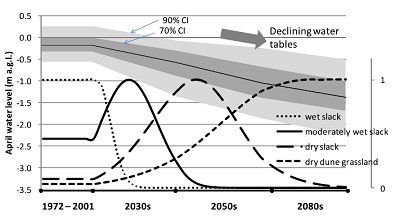
Graph showing likely changes in vegetation linked to water tables
Graph showing likely changes in vegetation under modelled declines in water tables

Dune slack plant and animal species depend on the groundwater regime, but their requirements are poorly understood. We characterised hydrological tolerances of dune slack vegetation across four UK sites. A 20cm difference in average water table regime separates wetter and drier slack communities, and only a 60cm difference separates the wettest slack community from dry dune grassland. However, while we know that water tables can vary substantially from one year to the next, we are still not sure how quickly plants respond to changes in hydrology.


Image
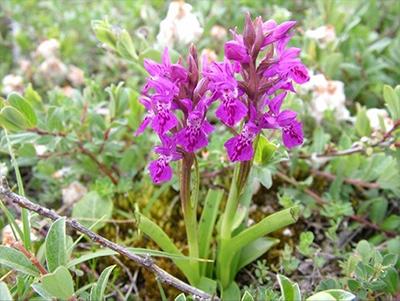
Northern marsh orchid (Dactylorhiza purpurella)
Photo: Northern marsh orchid – Dactylorhiza purpurella at Morfa Dyffryn

Groundwater nutrients affect dune slacks

Image
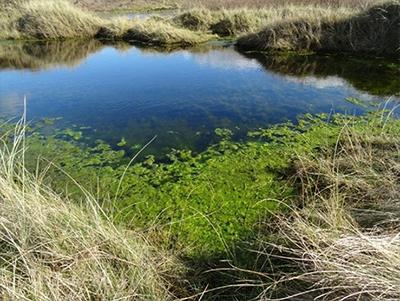
Algal growth caused by high nitrate levels in a dune slack at Aberffraw

We set up a study to assess the impacts of nutrients in groundwater on dune slack plant communities. This showed changes in species composition at very low nutrient concentrations: as little as 0.2 mg L-1 dissolved inorganic nitrogen in groundwater (equivalent to 0.9 mg NO3 L-1).

Field evidence of impact

Image
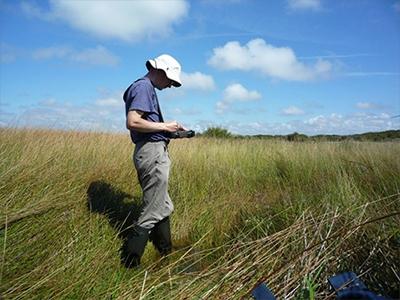
Surveying a dune slack at Birkdale on the Sefton Coast


Image
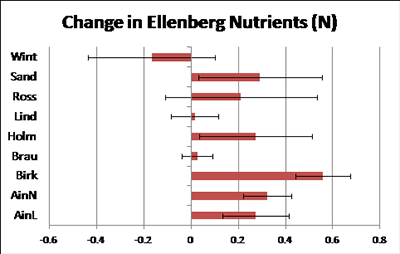
Chart showing changes in the nutrient index of dune slack vegetation in England 1990-2012
Chart: Changes in the nutrient index of dune slack vegetation in England, 1990 - 2012

We re-surveyed dune wetlands in England after a 22-year interval, in a study for Natural England. Results show a 30% loss in wetland extent, a change from wetter to drier vegetation types at many sites, and a consistent increase in nutrient status of the plants. This suggests rapid change in an important habitat for lowland biodiversity.

Nitrogen impacts on dunes

Image
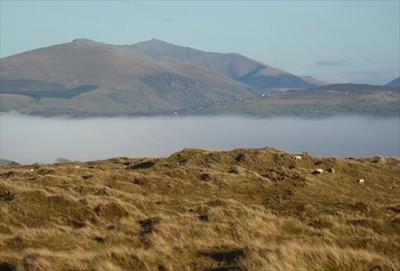
Overstablised dunes at Newborough Warren with Snowdon in the distance
Overstabilised dunes at Newborough Warren, with Snowdon rising above a sea mist in the background

Survey Evidence

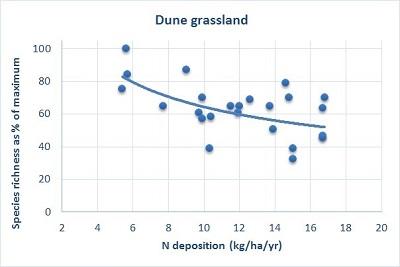
Nitrogen is one factor contributing to over-stabilisation of dunes. Because it stimulates plant growth, fast growing species outshade smaller and slower-growing species, leading to a loss in diversity. A gradient study suggests that higher levels of nitrogen pollution from the atmosphere have resulted in a 50% loss in species across much of the UK, compared to the cleanest sites.


Image
Graph showing number of plant species
Number of plant species as a % of diversity at the cleanest sites, data from Field et al. (2014)

Experimental Evidence

Earlier work showed that nitrogen also alters soil processes in dunes, with more nitrogen available to plants. We set up an experiment in 2003 to see whether management by grazing would reduce the effects of nitrogen. Results showed that nitrogen is taken up and stored in the vegetation, but has not yet had an effect on plant composition. This may because plant growth is limited by other nutrients.


Image
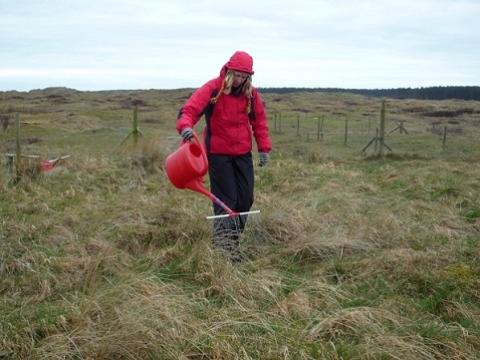
Applying nitrogen treatments in a grazing experiment
Photo: Applying nitrogen treatments in a Nitrogen x Grazing experiment

Developing indicators of nitrogen impact

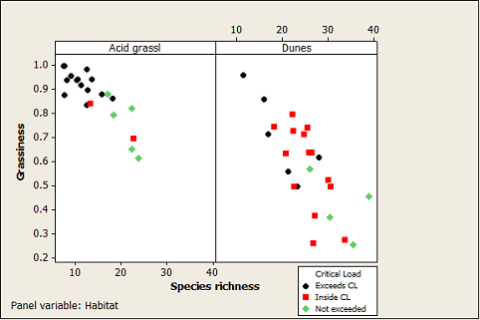
Recent work for the JNCC and for the Scottish Environment Protection Agency (SEPA) is designing ways to assess whether a particular site is impacted by nitrogen deposition. This will use plant abundance data collected on-site, and calculating different indicators such as average vegetation height, grassiness of the vegetation, plant species richness and presence of nitrogen-loving (nitrophiles) and nitrogen-hating (nitrophobes) species. Combining information from these indicators and comparing with data from other sites is a powerful way to detect whether a site is being affected by nitrogen.


Image
Graph showing combined indicators of grassiness and species richness
Graph: Combining indicators such as ‘Grassiness’ and ‘Species richness’ can provide site-based evidence of effects due to exceedance of nitrogen critical loads.


Principal Investigator