An update on the UK's water situation during the current dry weather from Jamie Hannaford and colleagues in CEH's Hydrological Status and Outlooks group...
Our previous blog posts discussed the dryness of late 2016 and early 2017, along with a damper interlude in summer 2017, culminating in a December 2017 update which highlighted the potential for drought and water resources stress in 2018.
This was prompted by the successive dry autumn/winter periods, which had reduced groundwater resources in much of southern and eastern England, increasing the chances of low groundwater levels and river flows in 2018. In the event, drought and water scarcity have indeed become discussion topics for summer 2018 – but not necessarily for the reasons we set out in the winter.
Weather conditions in spring and summer 2018 (so far)
Spring 2018 changed the water situation dramatically, as illustrated below. A very wet spring in the south and east of England replenished groundwater reserves, at the time largely assuaging fears of water resource stress in these areas.
So why are people talking about potential for hosepipe bans in summer 2018?
As shown in the March-May 2018 rainfall map below, while spring was wet in the southeast, the opposite was true for northern and western Britain, where spring was very dry – a reversal of the typical pronounced north-west/south-east rainfall gradient in the UK.
Since then, summer 2018 has got off to an exceptional start. Most of Britain enjoyed fine summer weather throughout June, including extended heatwave conditions in the final week that continued into early July.
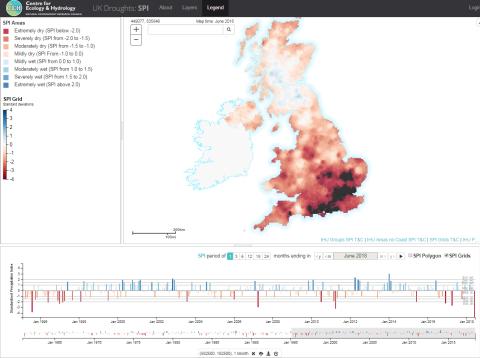
The exceptional June weather has recently been discussed by the UK Met Office. The dryness of June 2018 can be seen in the above Met Office rainfall map. CEH’s UK Drought Portal (see below) shows a similar picture – June was so dry in many parts of southern England that it was off the scale used to report rainfall deficits in the portal!

Above: The UK Drought Portal showing a map of June 2018 rainfall. Graph shows rainfall since 1995 for a selected point in Essex where rainfall was particularly low.
Many parts of south and east England received hardly any appreciable rainfall in June. At our Wallingford Met Site, we recorded 6.8mm on 1st June and then no rain days (days with rain >1mm) for the rest of the month. This period of consecutive no rain days is among the longest in the rainfall series (from 1962), and could result in a new record as the dryness continues into July.
Lack of rainfall
Unsurprisingly, some June regional rainfall records were approached, or broken in some cases. The Southern region we report on in our Hydrological Summary received 3mm of rainfall (just 6% of what would typically be received in June), making it the driest June on record. For the Thames and Wessex regions it was the 2nd driest on record (all in records from 1910).
For the Thames and Wessex regions it was the 2nd driest on record (all in records from 1910).
It was also very dry in much of northern and western Britain which, added to the dry spring in these regions, has resulted in significant rainfall deficits: for north-east Scotland, it was the driest April-June period since the 1984 drought.
June was also exceptionally warm. It was the 3rd warmest June on record for the UK as a whole (only 0.2°C behind 1976, the warmest). In some places previous June records were broken by a significant margin, e.g. in Wales and Northern Ireland. The late June heatwave also saw some very exceptional daily maximum temperatures – on 28th June, the highest temperature on record for Scotland (33.2°C) was recorded at Motherwell**see an update.
The current water situation
What is the impact of the dryness and summer warmth for hydrology and water resources?
A very obvious impact, familiar to everyone from the state of gardens, allotments or parks, is that soils have become very dry. A recent CEH blog post highlighted the dryness of UK soils as measured using our COSMOS-UK soil moisture network. COSMOS-UK provides field scale measurements of soil moisture but the records are relatively short (2013 onwards).
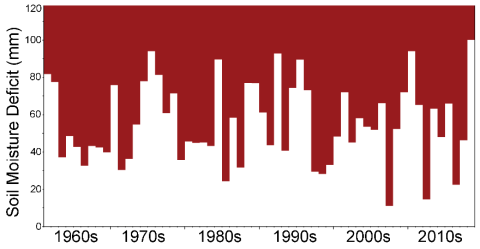
For a longer-term picture, the MORECS soil moisture data (from the Met Office) that we feature in the monthly Hydrological Summaries shows that, for the UK as a whole, end-of-June soil moisture was the driest on record (from 1961). It was also the driest soil moisture for any month since August 1995.

Above: End of June Soil Moisture Deficits for the UK, 1961 - 2018
For the UK as a whole, end-of-June 2018 soil moisture was the driest on record (from 1961). It was also the driest soil moisture for any month since August 1995.
As would be expected, the persistent dryness has caused widespread, and sometimes very steep, declines in river flows.
The map below shows low and notably low June average river flows in most of western England and Wales, Northern Ireland and in northeast Scotland. The June average flow on the Spey was exceptionally low, the third lowest for June in a record from 1952. In most of southern and eastern England, flows remain in the normal range, thanks to the residual effect of the wetter spring. The average river flows for the last two months tell a similar story.
Above: Average river flows for June 2018 and May-June 2018
It should be noted that these maps show average flows for June as a whole – in some responsive northern and western rivers, the daily flows in the final week approached the long-term minimum flows for late June, and flows have undoubtedly declined further in early July.
Reservoir levels and water demand
The dry conditions have led to decreased reservoir levels in some western areas, compounded by the high evaporation rates associated with the sustained hot weather. For example, reservoir stocks in Wales were around 10% lower than would be expected for the end of June. Generally, however, reservoir stocks across the UK are close to normal for the time of year.
Crucially, in south and eastern England where groundwater makes up a significant part of public water supply, levels in major aquifers are normal or above normal, sustained by the wet spring in these areas.
Crucially, in south and eastern England where groundwater makes up a significant part of public water supply, levels in major aquifers are normal or above normal...
There has inevitably been speculation about water restrictions such as hosepipe bans. A hosepipe ban was introduced in Northern Ireland at the end of June. In the short term at least, water efficiency campaigns and hosepipe bans are a response to the infrastructural challenges of meeting the high consumer demand resulting from the heatwave conditions, rather than major resource shortfalls.
The dry and hot weather has led to some other impacts, including wildfires in northern England and Wales, while low flows have already prompted fish rescues in some localities (e.g. on the river Teme in the Welsh borders). The lack of rainfall and dry soils are leading to increasing pressures for farmers and growers.
As usual, the regulators, water companies and other stakeholders involved in water management are all working together to manage the ongoing situation and mitigate risks to people and the environment (see a recent blog post from the Environment Agency).
What will happen next?
In the short term, indications are that weather conditions for the next week or two are likely to be similar, as the blocking anticyclonic conditions that prevailed in June and early July are likely to persist, albeit with lower temperatures and some welcome showers.
Beyond this timescale, weather forecasts are more uncertain. But while the warm, dry weather continues, soils will continue to dry out, while river flows and reservoir stocks will decrease more rapidly than they would normally in summer. Continued very warm weather will mean high consumer demand is maintained, adding to pressure on water resources.
Early next week, with our partners, we will be producing the Hydrological Outlook UK which will provide forecasts of river flows and groundwater levels for the next three months.
We will continue to track the water resource situation using our range of monitoring products. Next week we will also release the Hydrological Summary, providing a much fuller account of the current hydrological situation.
For regular updates on the soil moisture situation, COSMOS-UK is updated in real-time, every 15 minutes.
The Environment Agency also issues weekly river flows and groundwater updates for England.
Update
** Since this blog post was published, the Met Office has stated that they are unable to accept the provisional record temperature for Scotland observed on 28th June.
